John Freeman
BA Art & Design Studied at Birmingham University (Bournville Art School)
www.axisweb.org/p/johnfreeman
My main area of focus is printmaking using wood cut, screen print, drypoint, and linocut methods.
Recently achieved PTTLS Level 4
How the notion of ‘Chart junk or Good Design’ has affected my own art practice
The term with which I would start to use when referring to my work was ‘low-relief sculptural drawings’
Why my work has taken this direction I feel is because for a long time, I had become preoccupied with the notion of compartmentalisation/pigeon hole theories and how a space is divided up.
Where information and the storage of information is concerned.
Some of the questions that I am trying to raise in my art practice was how are decisions made in reference to the visual appearance, or the way information is stored, or passed on and displayed change the way we react to it or how we feel about it?
Certain ways of serving up sets of information or instructions are underpinned with ulterior motives so that people react in a certain way to suit the needs of some unknown quantity. Particularly in political circumstances when one political movement is trying to decry the views and opinions of another party, and turn the mood in favour of themselves.
I began to ask myself how I had been affected by how information had been given to me and not realised it?
To begin with my own art practice became larger taking the form of large scale worksheets working in a low relief sculptural manner, where a 2-D drawing with elements of found objects and sculptured objects built on to the drawing surface, until it becomes not a drawing and not a sculpture but something combined.
There was a strong presence of the mathematical, measuring device, counting systems, grid elements, shapes and forms, moving parts (which brought another aspect to the pieces, an interactive element inviting onlookers to ‘use’ some of the devices in the artworks.
One piece that did quite well was a mechanical drawing that consisted of an old desktop for a surface onto which was attached a large wooden rule which slid across the board, which gave a vertical measurement and a tape measure going left to right giving a horizontal measurement which supplied the work its interactive quality.
Shelving appears in the drawing yet absent of any objects. For a large part of the time the information which appears in my work has remained anonymous allowing me to concentrate on the visual aspects of the shapes and forms of graphical representation of information and as well as working with sculptural character of pigeon holes, compartments and containers.
The grid, which is a very popular device for displaying information, usually has a unit moving up and down either axis of it, be this time, place or amounts and a legend describing what the various colours and cross-hatchings denote.
What I have discovered through my research is that this is sometimes the worst offender when it comes to the hindering of an information display.
A piece of work I made based around the theory of the grid being employed as a graphical device that should not ‘over-throw’ the information and become the more dominant of the two but should ‘melt’ into the background becoming almost subliminal allowing the information to come forward. (see illustration)
The piece was made from a very light gauge paper, this was then folded into squares and left under pressure for a few days, after which it was soaked in tea in tea for a further three days. Then it was left to dry on top of a radiator.
What I was trying to achieve by doing this was to make marks without using paints or inks, but to try and effect the surface that left subtle changes in tone and intensity as opposed to drawing lines in the way a graphic artist might. Information was then hung down over the surface but no information was actually marked onto the paper, hence the piece was stressing the need and importance of a grid as part of a graphical landscape but not spoiling the view of information.
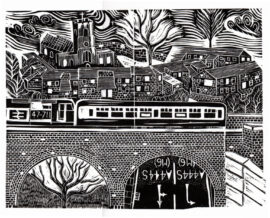
An example that Edward R Tufte gives in his book is a train schedule look up table by EJ Marey (see illustration) which shows a very vigorous grid system with lines drawn across it to show the time paths of trains. This example dates back to 1885, but it’s my opinion that some examples of today suffer from the same kind of problems. (See illustration) Sometimes I find it rather cumbersome reading train schedules, this is I feel a good example of too much ‘data-ink’ in a confined space, resulting in an information traffic jam.
With the gradual uprising of computers over recent times, along with the many advantages, it has also brought with it a huge amount of capabilities with decorating graphs and worksheets.
The most popular form seems to be colour, pattern, and combinations of the two. This use of cross-hatching and colours create a kind of strobe effect that reminds me a little of the work of Bridget Riley and Victor Vasarely.
This creates, in some cases, confusion due to constantly checking back to the legends and keys at the side of the graph. One thing this particular variety of ‘chart junk’ creates is an illusion of complication and a feeling that there is more data than what there actually is.
This is where the ‘data density’ of the graph becomes a concern, another term I came across in Edward Tuftes book.
Data density is the amount of data in a graph compared to the area of the graph for example one could say a graph the size of an A5 page containing 3 or 4 measurements has a low data density whereas a graph
the same size containing 300 or 400 measurements might be said to have a high data density.
But getting back to the idea chart junk, is it an ‘unnecessary’ evil of graphic design or does it go forward making information easier to read.
Colour and pattern has proved to be quite successful when used in road signage and such like.
Red is seen as a warning, blue is connected with giving information, but this opens up other arguments about the use of colours in society and their psychological effects of colour, where red signals danger, stop, warmth, and seems to come toward you, blue on the other hand appears calm and informative and recedes away from you.
As the sculptural side of my own art practice developed I began thinking again about compartmentalisation and how a 3-dimensional space is divided up for storing information. I created a piece with the image of a filing cabinet in mind and the qualities associated with them, such as their secrecy and sometimes inaccessible nature, and gave it a transparent door allowing the viewer to see inside. And so created a piece that was the opposite to that notion and used medium density fibre board and Perspex (clear) front, back, and top which allows the viewer to look into the cabinet without even having to open it. The door, which hangs free with no catch or lock, is again not, what you would expect from a filing cabinet.
However, when making the piece I was still concentrating on that notion of data and non-data and applying this to everyday objects such as a cabinet.
What parts of the cabinet are totally necessary and what parts are not, and do you discern between the two.
Further into my research I found the Utility Movement and designers who worked in and around that period.
This movement came about when materials were in short supply but furniture needed to be produced to a certain standard. This minimalist approach in design made me think of certain art movements particularly the minimalist movement. Particularly the artists Donald Judd (See illustration) or Sol le Witt, whose work does sometimes remind me of conceptual designs for furniture and other utility items.
However, as well as considering the notion of chart junk on good design this question for me is a little too broad to consider data graphics alone, and so I began to look elsewhere.
Everyday objects, cars, furniture, has all to some degree been affected by how or what someone may perceive as good or bad taste, are they ‘fashionable’, ‘up-to-date’, or ‘contemporary’.
Bedworth